Recently, I’ve spiced up literature lessons with infographics.
I love infographics. Plus, I love literature lessons.
Infographics are a modern approach to outlines, memes, and other “clickable” content. My students are familiar with their design elements, and they show me their favorites from around the web, usually pertaining to a television show or movie. Many of my students have Pinterest boards full of infographics. Since I love infographics and my students use them, I had to find a way to use them in class.
Plus, I’m always looking for scaffolding to help high school students move toward literary analysis. Infographics can be a stepping piece concerning more difficult elements of the story before students move to a literary analysis essay. (You can download all of my literature activities in a free PDF by clicking on the picture below.)
Sometimes, to get students to truly analyze a piece of literature, we need to break down the concepts. Infographics do that in a visual way, and you can easily add them to literature lessons.

I wanted to fill my literature lessons with infographics, at least enough to get feedback from students. So—I experimented (and had some failings!), but I finally found a balance for directions with infographics. I think most teachers can make their own and use these ideas.
What are the benefits of literature lessons with infographics?
An infographic breaks down information, so teachers can use infographics to break down any specific concept. In this blog post, I’m talking about using infographics with literature. Specifically, I’ve experimented with complex characters and motivations.
Used in the classroom, infographics are a visual representation of material, a modern twist on graphic organizers, and an endless way to provide visual learning. Here is how I added depth to literature lessons with infographics.
Make infographics meaningful to each student.
Turning students loose and asking them to build an infographic was my first mistake, and I’m pretty sure I didn’t meet my standards.
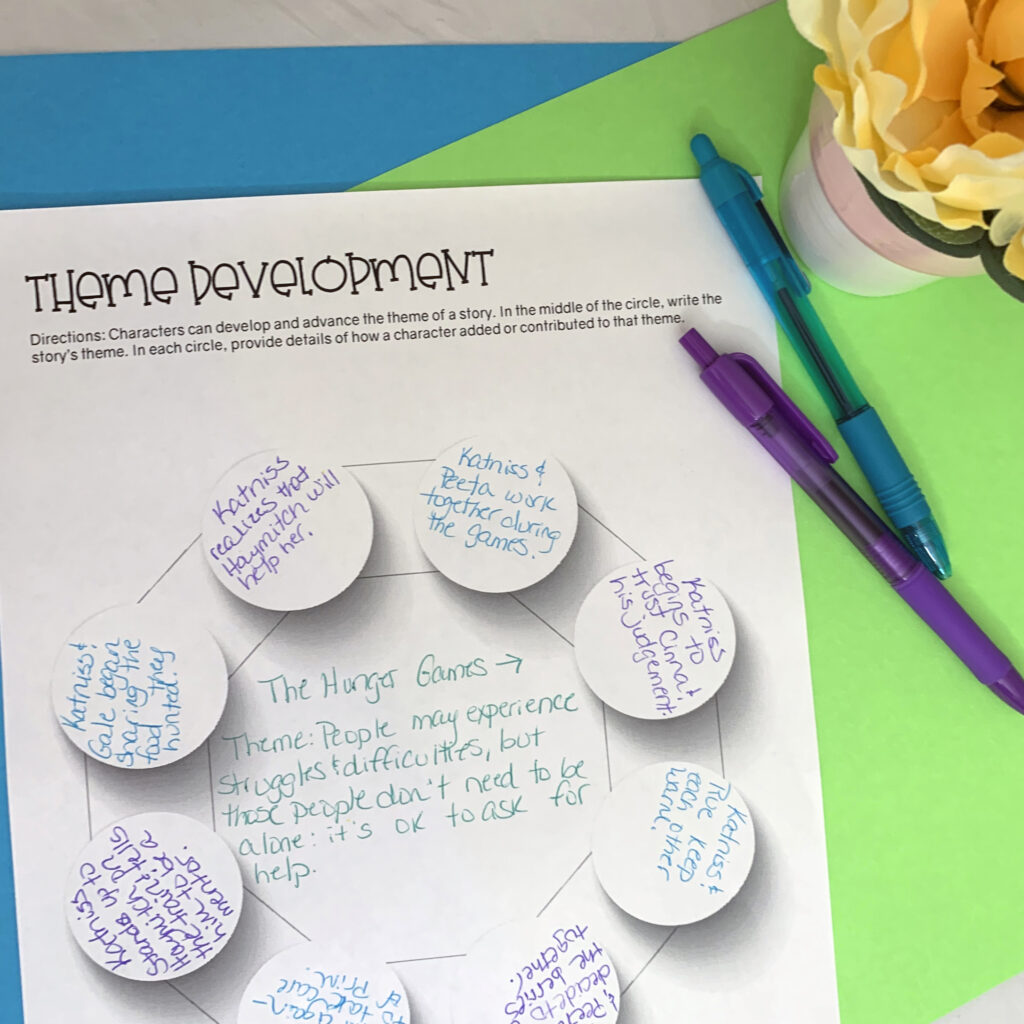
Create a slight structure. For instance, when I wanted students to break down a character, I didn’t simply ask them to break down the character because that is too general of directions. Instead, I labeled a few sections for a character; I put “indirect characterization” twice and direct characterization once. We discuss why: readers most often learn about characters indirectly.
Other times, I provided guidelines like universal themes, imagery, or other specific story elements.
I left other portions of the infographic blank for students to choose. . .
Allow the portions to be personalized.
I want English students to own the infographic and make it represent and explore the character, theme, or setting we are studying. Therefore, I leave enough portions blank or allow the pieces to be moved so students can decide what best explains their interpretation.
I also start the infographic with basic circles and squares. What if students add cubes? Diamonds? Graphs? The pieces are interactive and moveable. Encourage students to add beautiful graphics to the infographic.
Powerpoint, Canva templates, Google Slides.
The options for creating the infographic of a story are limitless. I know that some schools pay for Piktochart; mine pays for Canva. Using Canva allows students to organize complex levels of information beautifully. When my classes use an infographic as a capstone assignment or a more complete area of research, we use Canva.
Still, Google Slides works well for a general study of literature. Especially when I want a group of students to collaborate, I want to be included on the document. Plus, options for design are limited—which is good. I want students to dive into a piece of classical literature or interdisciplinary subject areas. The wide array of choices can bog down readers and insteadc of spending time on elements of stories, they focus on design.
Encourage the process.
Reading a book? Great. Good readers reread even short pieces. Because the infographics must be comprehensive, students must return to the book. I typically introduce character infographics half-way or more than half-way through a novel. Students may not feel they have the best answer for a spot. Perfect! Encourage students to return to the infographics to support review and ownership.
As we continue to read, I move students toward literary analysis and tackle some of those more complex standards. How do elements interact? How does a particular setting symbolize a character? When students build on their infographics, start showing students how the literary devices influence and shape each other.
As they work, you’ll see the differences of how students experience literature. These short bits of working through the process provides opportunities to scaffold individually.
Print them out.
I know: digital! Share them digitally (after checking them for accuracy). I do compile the infographics and share them for review, especially for complex subjects or background dealing with a story.
Excellent ones make perfect bookmarks and classroom displays. I use them for bulletin boards, something I struggle to make appropriate for older students.
Plus, during meet the teacher night or parent teacher conferences, displays are helpful to provide ideas of our classroom activities. Sometimes, literature lessons for older students don’t lend themselves to a display. After you print, display them on an easel or bulletin board to welcome guests.
Celebrate creativity.
What font embodies each character? Are the illustrations accurate? What colors best fit a character or theme? Students may have a different image of a character. Perfect! Draw the character, take a picture, and upload it for the infographic. Spruce up your infographic lesson plan. Learn from what they create and the way students experience literature.
Part of media literacy and cultural literacy is understanding that colors, shapes, and fonts contribute to the overall meaning of a message. Be sure to point out the intentional and perhaps unintentional messages students might send as they develop their infographics. You can find strong and poor examples on Snapchat, Instagram, and YouTube.
Programs and apps exist for digital ones, but as I previously mentioned, students sometimes want to show their art chops rather than study great literature. I used basic shapes and designs in Powerpoint. Then, I encouraged students to add pictures from around the web.
Embrace the benefits of infographics.
I enjoy infographics because students are familiar with them. They are simple organizational tools, note outlines, and reflections that allow students to categorize information. Honestly, you can add an infographic lesson plan to other areas of class. Teachers can differentiate assignments with them and clarify confusion on an individual level. If you have established literature activities that you and your students love, you can probably add in infographics.
Plus, they aid in comprehension. It might feel forced, but make students return to the story to find specific examples and quotes. Good stories require many readings, and a lot of literature requires multiple glances. These practice skills are simply good habits for lifelong learners.
Finally, a quick presentation of finished projects helps with public speaking skills. If you are at the end of the year, this activity will work!
Infographics are a non-intimidating way to review a story or focus on a character. Currently, I built infographics to analyze characters. Let me know what has worked for you.